In short. On the average of September and August 2026, TTF gas increases by about 74 %, Endex electricity by 63 % and Brent by 50 % between 2025 and 2026. September 2026 still exceeds this average by nearly 7 % for gas and electricity, and by nearly 11 % for Brent.
For a home heated with gas or oil, utilizing the photovoltaic surplus in hot water reduces the expense most directly exposed to fossil markets.
A very unequal energy shock
Talking about a general rise in energy masks an essential difference. Gas, oil, and electricity do not follow the same markets, are not indexed with the same delays, and do not represent the same share of the final bill.
To compare the two winters without relying on a single market day, we take the average of the months of August and September preceding each winter.
| Indicator | Average Aug-Sept 2025 | Average Aug-Sept 2026 | Increase |
|---|---|---|---|
| TTF Gas 101 ENGIE | 33.24 €/MWh | 57.83 €/MWh | +74.0 % |
| Electricity Endex 101 | 77.36 €/MWh | 126.32 €/MWh | +63.3 % |
| Average Brent | 67.93 $/barrel | 102.02 $/barrel | +50.2 % |
Data available as of September 30, 2026. The average for September 2026 of Brent is provisional and is based on EIA quotes available until September 22. The average for August-September is an indicator of winter preparation, not the price realized throughout the winter 2026-2027.
A wholesale price does not automatically become a bill
An increase in a wholesale index does not automatically lead to an identical increase in the bill. For gas and electricity, the supplier's formula combines a market index and a constant. The bill then adds network costs, excise duties, VAT, and fixed fees. For heating oil, the Belgian price depends notably on the quotes of refined products, the exchange rate, distribution margins, and contributions.
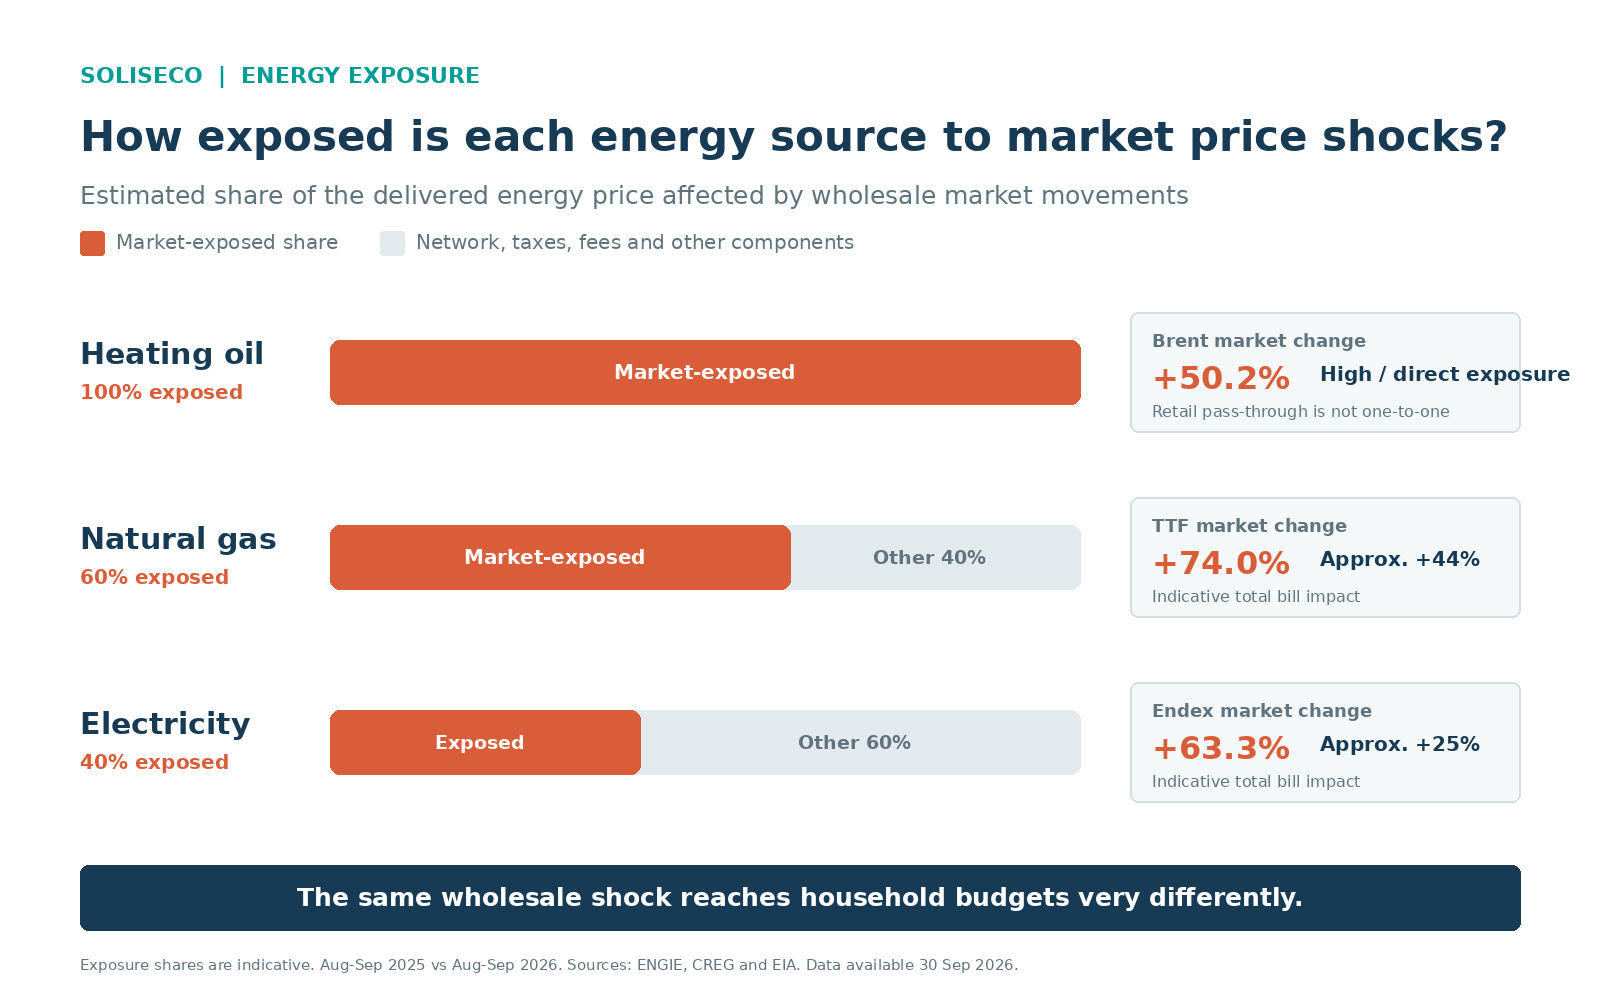
However, this dilution should not overshadow the household's exposure. CREG estimates that the energy component represents about 60 % of a gas bill and 40 % of an electricity bill. In a heating oil purchase, almost the entire budget allocated to heating remains tied to the price of the delivered fuel.
| Index | September 2026 | Difference with the average August-Sept. 2026 |
|---|---|---|
| TTF Gas 101 | 61.76 €/MWh | +6.8 % |
| Electricity Endex 101 | 134.51 €/MWh | +6.5 % |
| Temporary average Brent | 112.96 $/barrel | +10.7 % |
By applying the orders of magnitude from CREG, the 74 % increase in TTF represents about 44 % on a total gas bill if the other items remain unchanged. The 63 % increase in Endex represents about 25 % on a total electricity bill.
The September level adds, compared to the average of August-September 2026, about 4 % on the gas bill and 3 % on the electricity bill. For heating oil, Brent is a trend indicator: its 50 % increase does not mechanically translate to the delivered liter, but almost the entire heating oil budget remains exposed to the price of the purchased fuel.
Why Soliseco is the optimal solution against rising gas and oil prices
In an average home, heating consumption is often much higher than electricity consumption. A household can for example use about 3,500 kWh of electricity per year compared to 17,000 kWh of gas.
This means that when gas or oil prices rise sharply, the impact on the household budget can be much more significant than that of an increase in electricity.
A battery primarily reduces electricity purchases from the grid. Soliseco, on the other hand, uses surplus photovoltaic energy to directly reduce gas or oil consumption intended for hot water and heating.
This is particularly interesting today: between August-September 2025 and August-September 2026, the gas index increased by about 74 % and Brent by about 50 %, compared to about 63 % for electricity.
With an assumption of 30 % reduction in fuel consumption thanks to Soliseco, the annual savings reach approximately:
- 576 € for a gas household
- 715 € for an oil household
By comparison, reducing electricity purchases by 30 % would represent about 464 € per year for a household consuming 3,500 kWh.
Soliseco allows you to use the solar surplus where it protects the budget the most: on heat consumption, which is often more significant and more exposed to fluctuations in gas and oil prices.
The higher the fuel price rises, the more valuable each solar kWh used to produce hot water and heat becomes.
-----------------------------------------------------------------------------------------------------------------------------------
An analysis of the consumption profile allows estimating the valorizable surplus and the amount of gas or oil that can be avoided.Switch from solar production to the
budget protection
Sources and method
- ENGIE, gas indexing parameters : TTF 101 for August and September 2025 and 2026.
- ENGIE, electricity indexing parameters : Endex 101 for August and September 2025 and 2026.
- CREG, findings from April 2026 : approximate share of the energy component.
- EIA, Europe Brent Spot Price : monthly averages 2025 and prices available in 2026.
- SPF Economy, oil prices : maximum prices and Belgian mechanism for petroleum products.
Method. Nominal comparison of the arithmetic averages of August and September 2025 and 2026. The impacts on bills are orders of magnitude obtained with an exposure of about 60% for gas and 40% for electricity. They do not constitute a price forecast or a promise of savings. Actual savings depend in particular on the contract, the region, the performance of the installation, the hot water needs, and the available photovoltaic surplus.